 Current position:Home> Case> Comprehensive exploration and scientific research projects>Comprehens...
 Comprehensive physical prospecting is carried out to identify the development of geological structures and the existence of coal seams in the 100m range in front of the face of the digging work, and the construction of headway over-drilling holes is carried out according to the design of the anomalous area of the physical prospecting to verify the anomalous area of the physical prospecting.
Mining Geological Probe DTC1800, Transient Electromagnetic Instrument YCS75, Mining Lateral Resistivity Video Imaging Logging Instrument YZD18.5, as shown below:

Figure 1-1-1 DTC1800 Mining Geological Explorer Equipment Diagram
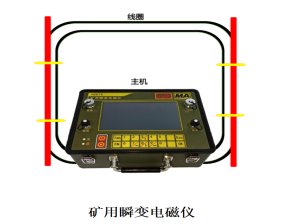
Figure 1-1-2 YCS75 Transient Electromagnetic Instrument Equipment Diagram

Figure 1-1-3 YZD18.5 Mining Lateral Resistivity Video Imaging Logging Instrument Equipment Figure
MTRT method in the field construction, the excitation point and receiving point are arranged in the left gang of the roadway in the same coal and rock layer, see Figure 1-1-4 shows; MTRT method detects the detection range in front of the head of the digging face, see Figure 1-1-5 shows.
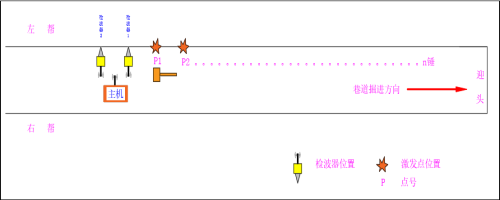
图1-1-4 MTRT现场施工测点布置图
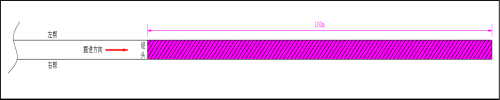
Figure 1-1-5 Schematic of MTRT overdetection range (purple area is detection range)
Transient electromagnetic method measurement line layout, according to the detection location of geological data and site conditions of comprehensive analysis, the design of the detection line, shown in Figure 1-1-6; transient electromagnetic method to detect the detection range in front of the head of the digging face, shown in Figure 1-1-7.
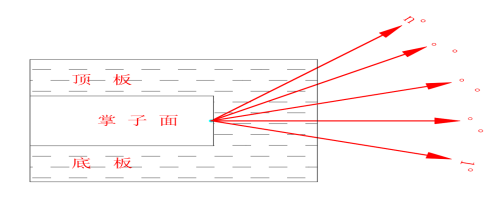
Figure 1-1-6 Schematic diagram of transient electromagnetic measurement line arrangement
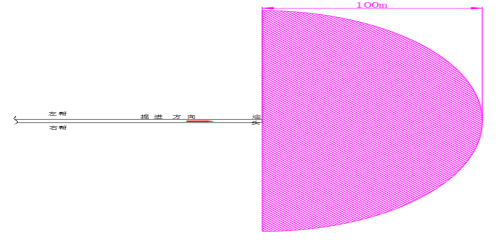
Figure 1-1-7 Schematic of the detection range of the transient electromagnetic method (purple area is the detection range)
After the headward overrun detection by seismic MTRT method is adopted, drilling is carried out to verify the anomaly zone delineated by seismic detection, and the headward overrun drilling is utilized to carry out comprehensive logging for each drill hole by using the mining lateral resistivity video imaging logging instrument, and through the collection of natural gamma, apparent resistivity, natural potential, excitation potential, drilling trajectory, peeping, well temperature, and other data of the drilling holes, which are processed by the software, and then combined with the geological data and the comprehensive analysis of the site conditions, the logging results are comprehensively interpreted to calculate the range of fault structure fall of the drilling hole. After the software processing, combined with the geological data and the site conditions, we analyze and interpret the logging results based on the logging curves, trajectory data and peeping data, produce the columnar diagram of the coal and rock layers in the drill holes, and calculate the range of the fault tectonic fall in the anomaly area.
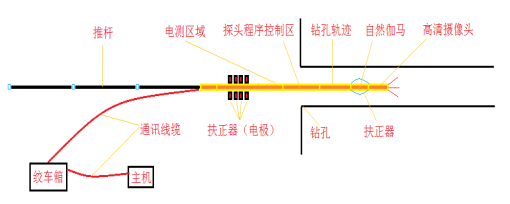
Figure 1-1-8 Drilling Construction Drawing
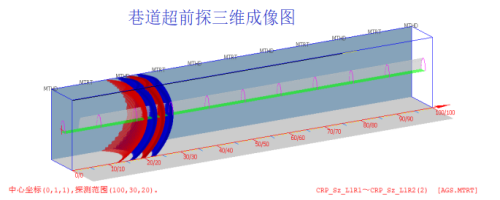
Figure 1-1-9 Map of seismic wave detection results
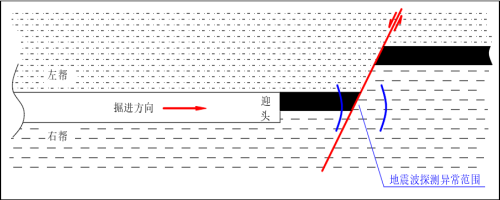
Figure 1-1-10 Seismic wave detection anomaly range results map

Figure 1-1-11 Transient Electromagnetic Method Detection Results Map

Figure 1-1-12 Diagram of Drillhole Logging Results
In order to ensure the safety of coal mine production, a mine of Shenhuo Group was affected by fault structure in the 29020 cut eye bottom pumping tunnel, so the seismic wave ahead detection (MTRT) technology was used in combination with the drilling and logging technology to detect the fault.
In order to ensure the safety of coal mine production, MTRT and borehole logging were used to detect the fault structure. To find out the development of fault structure in front of the 29020 cut eye bottom draw, and to provide reliable geological data for the safe tunneling of the roadway.
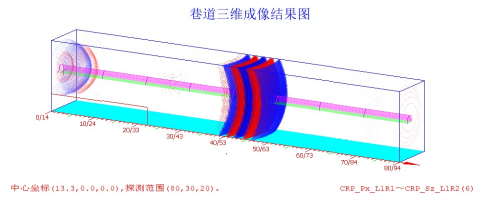
Figure 1-1-13 Seismic Wave Detection Results Map
①The results of MTRT can be seen in front of the headland there are two reflection interfaces, named R1, R2, R1 is located in front of the headland about 7m position due to the influence of faults; R2 is located in front of the headland about 38-45m position for the development of tectonic.
② Drilling logging detection through the natural gamma curve, visual resistivity curve, natural potential curve comprehensive analysis for 17.7m see coal 19m over coal, 19.9m see coal 23m over coal, 46.9m see coal collapsed holes have not been detected to the bottom of the hole.
③Combined with the seismic wave over-detection and borehole logging results, the A-seam coal and the B-seam coal are the same layer of coal, and the stratification is caused by the influence of the fault (R1 reflection interface).
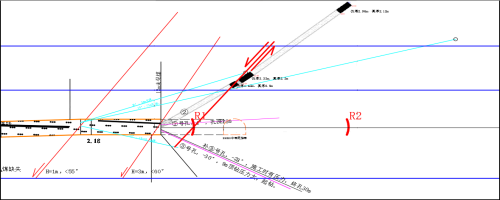
Figure 1-1-14 Combined results of seismic wave (MTRT) overshooting and logging detection
Comprehensive physical exploration was carried out at the opening of the bottom draw of a machine tunnel of a mine in Ping Coal at a location 68m inward.
The transient electromagnetism showed low-resistance responses in the range of 40m-60m in the three directions of 45°upward detection, downward detection and 45°downward detection. Combined with the seismic detection, there are obvious abnormal interfaces in the range of 40m-46m in front of the headway, and the comprehensive analysis deduces that there is a geological structure in the range of 40m-46m in front of the roadway headway.
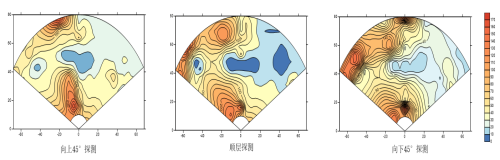
Figure 1-1-15 Transient Electromagnetic Detection Results Map

Figure 1-1-16 Seismic Detection Results Map
A mine 115 boring face is digging along the bottom plate of No.11 coal seam, and the mine designs and constructs 4 pre-drilling holes in the roadway headway to explore the coal seam existence status and the development of geological structure in front of the working face, but after the construction of the holes is completed, it is still impossible to judge the coal seam existence status. Entrusted by the mine, Xuzhou Ruituo used mining lateral resistivity video imaging logging technology to log the overrun drill holes in the working face and comprehensively analyze the logging data.
According to the four logging curves of natural gamma, natural potential, apparent resistivity and excitation potential, combined with the drilling trajectory and roadway excavation data, two faults were developed in front of the working face, the F1 fault dipping at about 54°, and the F2 fault dipping at about 55°, with a drop of about 5.5 m. The F1 fault dips at about 54°, and the F2 fault dips at about 55°, with a drop of about 5.5 m. The F1 fault dips at about 54°, and the F2 fault dips at about 55°.
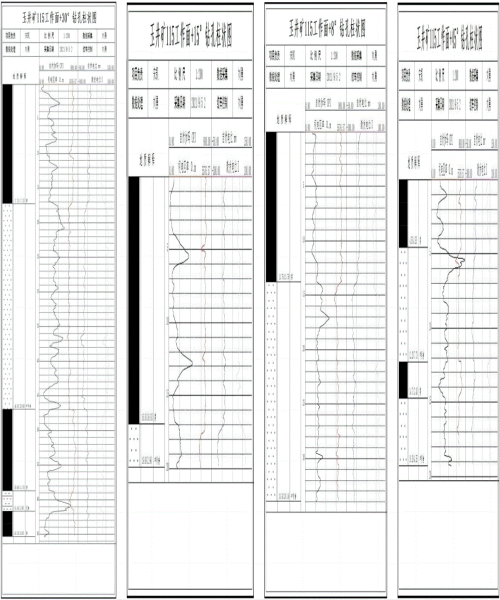
图1-1-17 钻孔综合柱状图
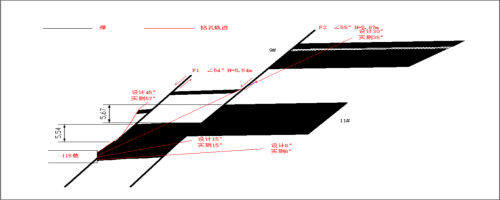
Figure 1-1-18 Comprehensive Analysis of Culvert Headway Logging Results
Comprehensive physical prospecting is carried out for the back-mining face, and the radio wave perspective method is used to find out the distribution of the coal thickness greater than 1/2 of the drop, the diameter of the long axis is greater than 30m of the trapped columns and other geological anomalies in the working face, and the drilling and accurate digital logging technology and physical prospecting detection technology are utilized, to comprehensively analyze the exposure data of the working face and the results of the physical prospecting, to research the coal seams' state of existence in the back-mining face and the development of the geological structure, and to construct a three-dimensional geological model of the working face based on the digital Based on the digital logging data, a three-dimensional geological model of the working face is constructed, so as to achieve transparent mining of the working face.
Mining radio wave penetrometer YDT150 and mining lateral resistivity video imaging logger YZD18.5 are used, as shown in the following figure:
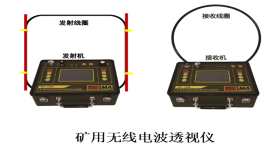
Figure 1-2-1 YDT150 Radio Wave Transilluminator Equipment Diagram
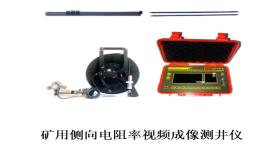
Figure 1-2-2 YZD18.5 Mining Lateral Resistivity Video Imaging Logging Instrument Equipment Diagram
The radio wave penetration method detection work using fixed-point method detection, that is, the transmitter is relatively fixed in the position of the well-marked transmitting point, the receiver in a certain range of adjacent roadway point-by-point along the roadway to observe the field strength value.
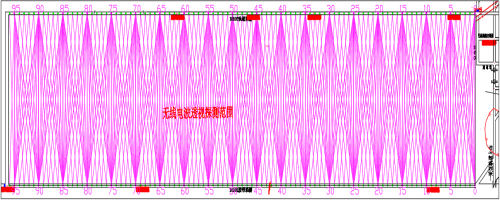
Figure 1-2-3 Layout of radio wave penetrometer lines
In order to realize the transparent mining of the return mining face, the construction of gas discharge holes for logging in the middle pumping lane of the bottom plate of the working face, combined with the radio wave perspective, to find out the existence of coal seams in the upper part of the middle pumping lane and the development of hidden tectonics.
1-2-4 Single Row Borehole Construction Layout Sections
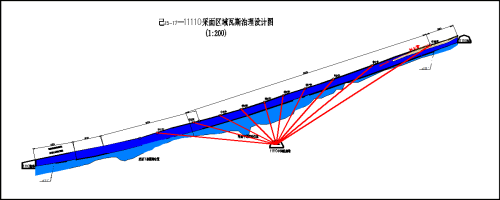
In order to realize transparent mining in the working face of 15-17-11110, a mine of Ping Coal Co. commissioned Xuzhou Ruituo to carry out logging of 191 gas drainage holes in the middle pumping lane of the bottom plate of the working face, which was combined with radio-wave visualization to find out the existence of coal seams in the upper part of the middle pumping lane and the development of hidden tectonics.
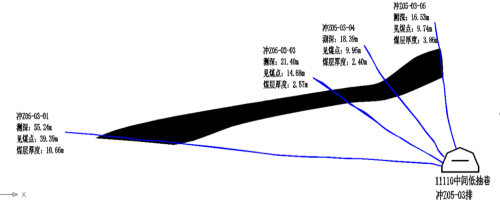
Figure 1-2-5 Results of Detection of Platoon Z05-03
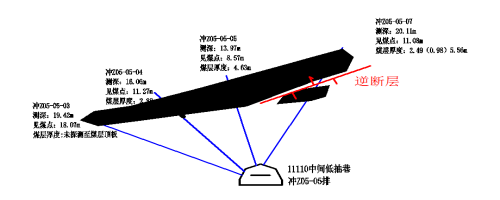
Figure 1-2-6 Detection results of row Z05-05 of punch
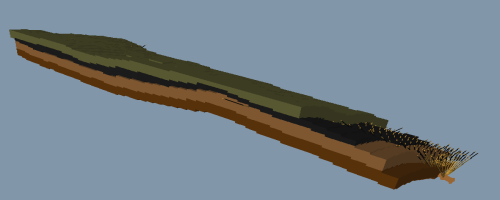
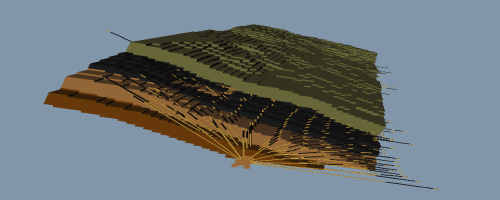
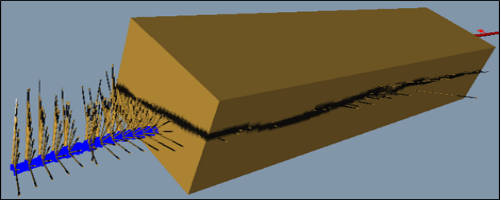
Figure 1-2-7 Three views of the working face based on logging results
①Combined with the results of pit penetration and the surrounding geological data, reverse faults are found from row Z10-5 to row Z4-3, which are consistent with the reverse fault with a fall of 5.0m exposed by the wind tunnel, and the fall of the fault is gradually decreasing from northeast to southwest, and the fall of 5.0m exposed by the wind tunnel is gradually decreasing to about 2.0m near the machine tunnel.
② Positive faults are found in rows Z13-9 to Z13-14, which are consistent with the positive fault with a drop of 2.5m exposed in the machine lane.
③The thickness of the coal seam ranges from 1.9m to 7.4m, and the thickness of the coal seam varies greatly in the local area under the influence of the fault, and the relatively thinning area of the coal seam is mainly concentrated near the stopping line of the machine lane, with the thickness of about 2.5m-3.5m, while the relatively thicker area of the coal seam is mainly concentrated in the central part of the mining face near the eye of the cut, with the thickness of more than 6.5m.
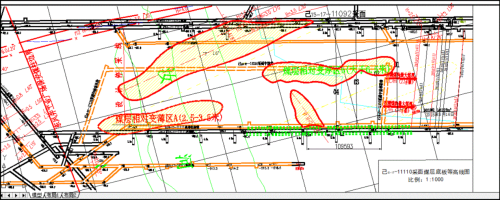
Figure 1-2-8 Comprehensive analysis of the results of the work surface
Yuanyi Mine of Anhui Huaibei Mining Group, adopts slot wave and mining lateral resistivity video imaging logging technology, uses slot wave detection for the working face, and logging detection for the gas drainage holes (120 holes) in the low-pumping lanes, to explore the coal beds' existence and the development of hidden tectonics in the 1037 working face, so as to achieve the purpose of transparent mining in the mining face.
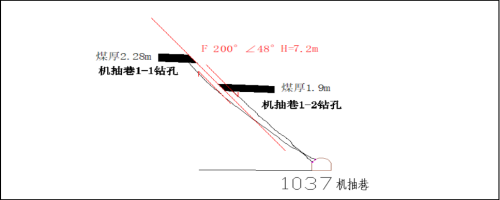
Figure 1-2-9 F200 fault profile at 9.6m in front of B4 measurement point
① Through analyzing the column diagram and track profile of 1-1 and 1-2 drill holes at 9.6m in front of the B4 measuring point of the bottom pumping lane of the machine lane, it is judged that the (F 200°∠48) fault exposed by the bottom pumping lane of the machine lane has a fall of *** (7.2m) near the final hole position of 1-1 and 1-2 of the bottom pumping lane of the machine lane, and has a tendency of getting smaller (about 2.0m) in the northwesterly and southeasterly directions.
② Comprehensively analyzing the results of borehole logging and 3D results of the mining face, it is presumed that: 1035F2 fault extends 14m~20m to the 1037 working face; aF12 fault extends 20m~28m to the 1037 working face.
(iii) According to the comprehensive analysis of the drilling logging results, the thickness of the coal seam in this working face is between 0.3m and 6m, and the thickness of the coal seam varies greatly in the local area under the influence of the fault.
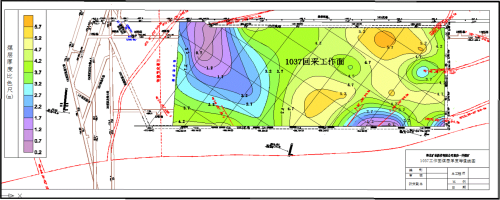
Figure 1-2-10 Coal Thickness Contour Plot of Mining Face Based on Detection Results
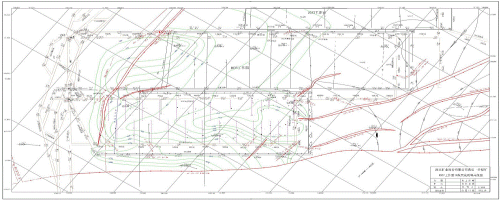
Figure 1-2-11 The contour line of the coal bed bottom plate of the mining face drawn according to the exploration results
Mining Lateral Resistivity Video Imaging Logging Instrument YZD18.5 is based on borehole diameter ≧ 42mm, which collects borehole logging parameters (natural gamma, apparent resistivity, natural potential, excitation potential), borehole track, depth, video peep data at one time, and analyzes the stratum lithology, layer thickness, and spatial location. Applicable drill holes are shown below:
① water exploration and discharge drill holes, gas discharge holes, geological overrun exploration holes, tectonic coal exploration holes, anchor holes, and other types of engineering drill holes and other drill holes of various diameters for detection;
Geological overrun probe holes: overrun probe holes for the construction of the head of the digging face;
Gas extraction holes: gas extraction holes constructed in the side gang and roof of coal mining face;
Water discharge holes: drill holes constructed in waterlogged areas such as the face of excavation workings, hollow areas, old roadways, aquifers, and other waterlogged areas;
Tectonic coal exploration holes: drill holes constructed for faults, trapped columns, inclined and backward inclined structures;
Anchor holes: generally in the roadway roof construction of anchor support holes, drilling depth is not long, the main solution to the roof of the three zones “fall zone, fissure zone, slow sinking zone”, to observe the roof of the “pseudo-roof, direct roof, the old roof” of the layer and the broken situation;
②Apply to any inclined angle drilling holes including vertical holes;
③Detecting the problems of hollow area, water discharge, stratigraphic abnormality, top plate delamination, faults, and trapped columns.
1、Top plate observation
Detection of abnormalities such as off-stratum development, tectonic development, fracture zones, fissure zones, etc. above the roof of the mined coal seam: using the high-definition camera peeping function of logging instrument to determine the location of fracture zones and fissure zones of the strata inside the borehole, and then determining the location of abnormal layers of the strata based on the lithological stratification of the logging instrument to provide technical support for the next step of the division of the “three belts” of the coal and rock strata above the roof. Provide technical support.
In a coal mine in Guizhou Province, the “three zones” underground drill holes were logged to find out the distribution of coal and rock strata above the C8 coal seam in the air-mining zone, the development of fissures and fracture zones, and the deviation of the drilling trajectory;
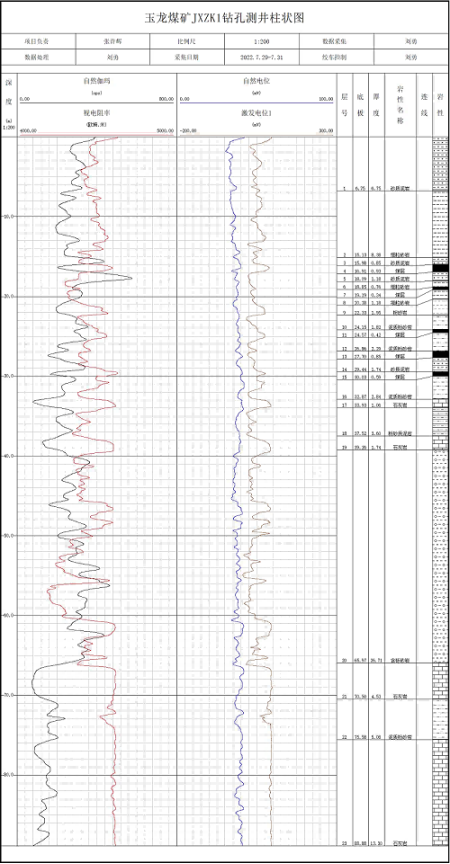
Figure 2-1-1 Drill hole composite histogram (all coal seam thicknesses shown in this figure are pseudo thicknesses)
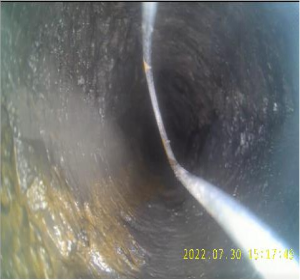
Figure 2-1-2 Screenshot of fracture development at coal-rock interface in drill hole
Figure 2-1-3 Screenshot of the development of fracture zones in the conglomerate-bearing sandstone layers of the drill holes
Figure 2-1-4 Screenshot of the development of a fractured zone in the limestone layer of the drill hole
A coal mine in Shaanxi Province adopts the mining lateral resistivity video imaging logging technology to conduct logging exploration of the top plate drilling holes, and the main task is to identify the coal and rock layer endowment above the top plate and the deviation of the drilling trajectory;
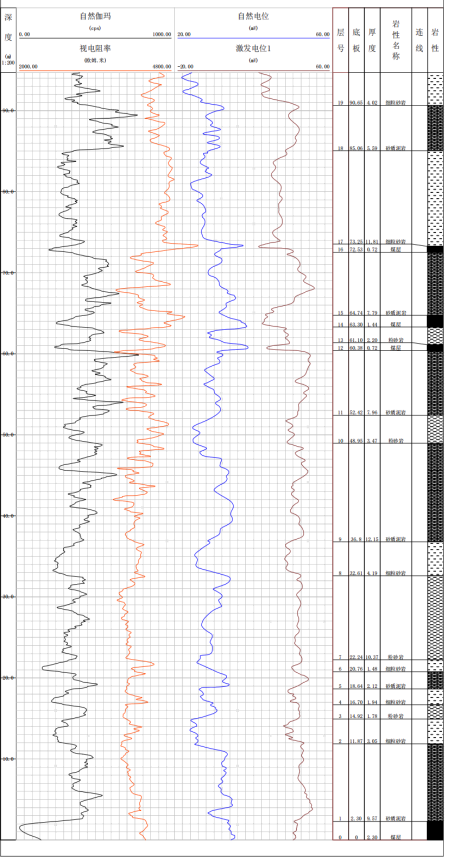
Figure 2-1-5 Drill hole composite histogram (all coal seam thicknesses shown in this figure are pseudo thicknesses)
Figure 2-1-6 Screenshot of Drillhole Fracture Zone Development
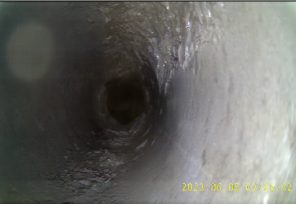
Figure 2-1-7 Screenshot of Drillhole Fracture Zone Development
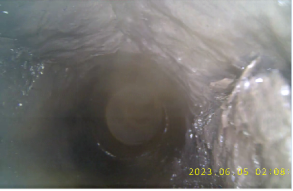
Figure 2-1-8 Screenshot of Drillhole Fracture Zone Development
Detecting the cause of water discharge: Use the high-definition camera peep function of the logging instrument to determine the location of the water discharge point inside the borehole, and then determine the water discharge layer according to the lithological stratification of the logging instrument to determine the cause of water discharge, as shown in the following figure:
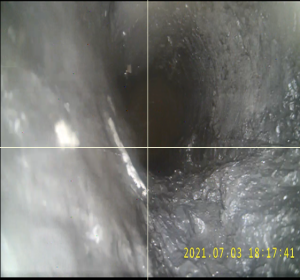

Figure 2-2-1 Video Screenshot of Borehole Logging Outflow Points
Detection of anomalies such as tectonic development, fracture zones and fissure zones inside the bottom plate borehole: utilize the high-definition camera peeping function of the logging instrument to determine the location of fracture zones and fissure zones in the internal stratigraphy of the borehole, and then determine the location of anomalous layers of the rock stratum based on the lithological stratification of the logging instrument as shown in the figure below:
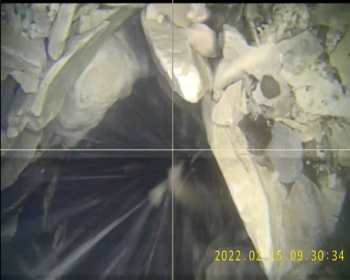
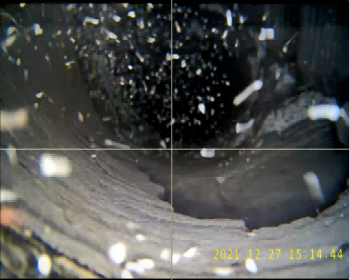
Figure 2-3-1 Video Screenshot of Drillhole Logging Fracture Zones and Tectonic Zones
Airspace detection: In order to find out whether there is an airspace in front of the roadway, 10 pre-detection drill holes were designed and constructed, and 3 of them were logged, using the high-definition camera peep function of the logging instrument to determine the location of the stratigraphic fracture zones and fissure zones inside the drill holes, and then determining the abnormal layers of the rock strata based on the lithological stratification of the logging instrument.
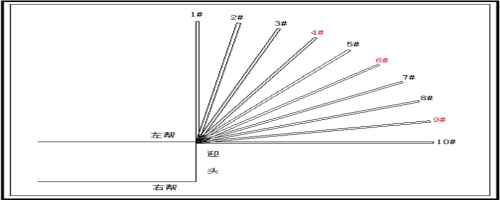
Figure 2-4-1 Schematic diagram of the layout of the super-exploration drill holes
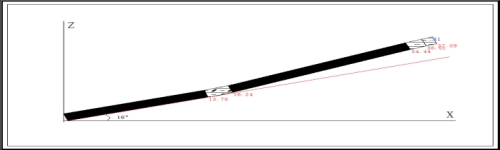
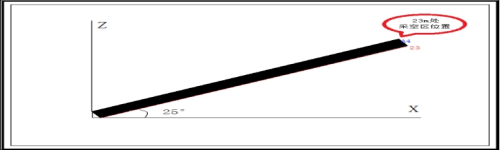
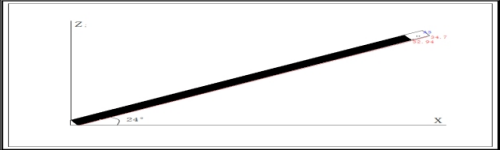
Figure 2-4-2 Histogram of drilling trajectory
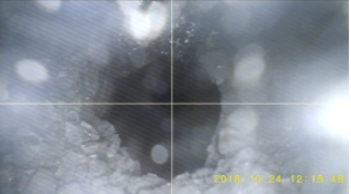
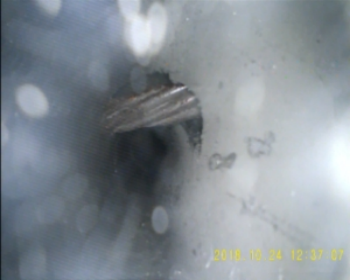
Figure 2-4-3 Screenshot of view of drilling holes to see anchor cables for support of open areas and other roadways
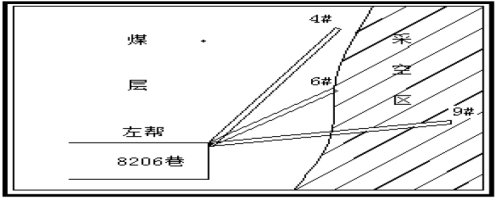
Figure 2-4-4 Schematic diagram of the head-on front face.
In September 2020, mining lateral resistivity video imaging logging technology was used to log 19 roadway roof drill holes in the inlet chute and 11 roadway roof drill holes in the return chute of a mine's 9102 working face, respectively, to investigate the thickness and structure of the coal seams in the roadway roof of the 9102 working face and the changes thereof.
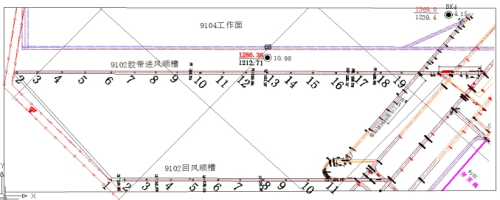
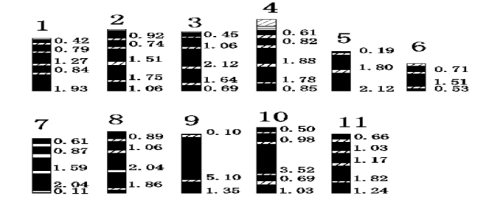
图2-5-1 回风顺槽钻孔测井煤层柱状示意图
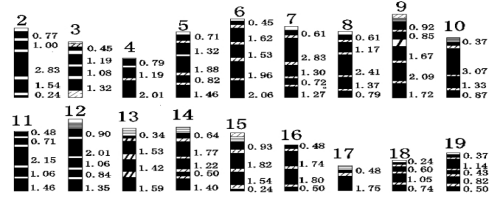
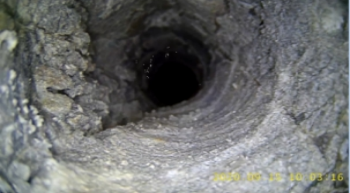
Figure 2-5-2 Schematic diagram of columnar shape of coal seams of the logging hole drilled in the inlet downhole
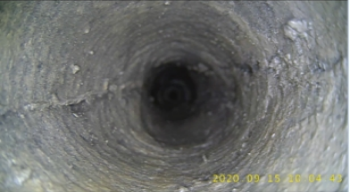
Figure 2-5-3 Screenshot of video of coal seam fissure development
Analyzing the results of logging, the thickness of the coal seam at the top of the roadway above the downtube is 2.46m~9.05m, average 6.40m, and the coal seam in the detection area generally contains 4 layers of gangue, with the thickness of a single layer of 0.16~0.85m, and the structure is more complicated. The thickening area of the coal seam at the top of the roadway is at the No. 5-15 measuring point of the inlet chute, and the thinning area is at the No. 17-19 measuring point of the inlet chute (at the opening of the inlet chute) and the No. 5 and No. 6 measuring points of the return chute. Generally speaking, the coal seam in the working face is unstable and the thickness varies a lot, except for the opening of the inlet chute, the thickness of the top coal of the roadway in the inlet chute is thicker than that in the return chute.

Figure 2-5-4 Contour map of coal seam thickness at working face
Seismic wave (MTRT) forward detection technology and (MSPT) profile detection technology were used to detect the head of the boring face and the side gangs of the roadway, and to find out the scope of influence of the anomalous body of trapped columns in front of the head of the boring face and the side gangs of the roadway, and the detection conditions are as follows:
Mining Geological Tester DTC1800, as shown in the figure below:
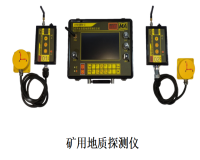
Figure 3-2-1 DTC1800 Mining Geological Explorer Equipment Diagram
When using DTC1800 type mine geology detector for MTRT seismic over-detection construction of the head of the digging face, the excitation point and reception point are arranged in the left gang (right gang) of the roadway, see Figure 3-3-1 shows.
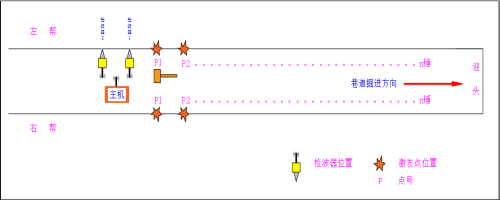
Figure 3-3-1 MTRT overdetection site construction measurement point layout
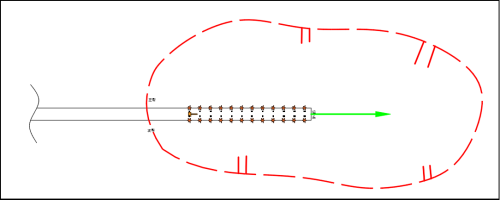
Figure 3-3-2 Schematic diagram of MTRT overdetection construction
The use of DTC1800-type mining geological detector on the digging face of the left gang (right gang) MSPT seismic profile detection in the field construction, respectively, in the head of the retreating digging face of the left gang (right gang) arrangement of n detection points, which each detection position, the arrangement of a hammering excitation point, two reception points, two reception points using the external three-component geophone receiver, where the source of the detection distance of 1m, the road spacing of 1m;
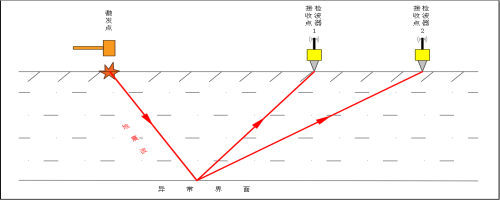
Figure 3-3-3 MSPT Profile Detection Site Construction Measurement Point Layout
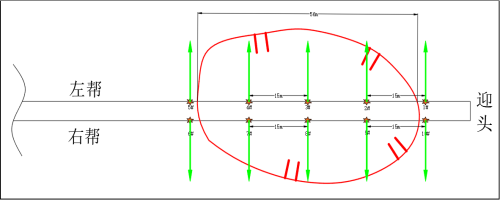
Figure 3-3-4 Construction Schematic of MTRT Overdrive Probe
A total of 2 groups are constructed in the left gang (right gang) of the roadway for MTRT seismic precession detection at the head of a mine's trackway face; 5 groups of detection positions are arranged in the left gang of the roadway for MSPT seismic profile detection at the head of the roadway at a range of 40m backward, with the hammering point and reception point arranged in the coal seam, and the wave velocity of MSPT seismic profile detection adopts 1550 m/s.
Figure 3-4-1 Map of Integrated Results of Seismic Wave Detection (Drilling Verification and Detection Results)
In a mine, the headway MTRT seismic overdrive detection in the trackway left gang and right gang of a trackway is constructed in 2 groups in total, the hammering point and receiving point are arranged in the rock layer, and the wave speed of MTRT seismic overdrive detection is 2200m/s. The MSPT seismic profile detection in the range of 50m back from the headway is arranged in 9 groups in the left and right gangs of the roadway;
The MSPT seismic profile detection in the left and right gangs of the roadway is arranged in 9 groups of detecting positions, respectively, 7 groups are arranged in the left gang of the roadway and 2 groups are arranged in the right gang of the roadway in the range of 50m behind the headway; among them, 3 left gangs of the roadway and 1 right gang of the roadway after the headway are arranged in the coal layer, and the wave velocity of the MSPT seismic profile detection adopts 1500m/s; the rest of the units are all arranged in the rock layer, and the wave velocity of MTRT seismic overdrive detection adopts 2200m/s; the wave velocity of MSPT seismic profile detection is adopted in the rock layer. The wave velocity of MSPT seismic profile is 2200m/s, which is basically in line with the exploration results after drilling and verification by the mining party.
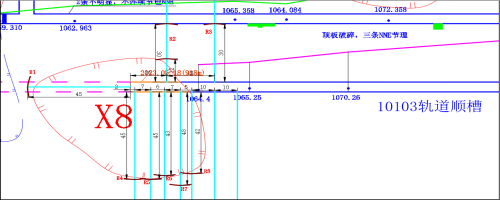
Figure 3-4-2 Seismic Wave Detection Comprehensive Results Map
Mining intrinsically safe resistivity logging instrument, in the coal mine underground drilling as the basis, a one-time completion of the drilling logging data (natural gamma, apparent resistivity, excitation potential, natural potential), drilling trajectory data (drilling orientation, inclination), drilling depth data acquisition. Specialized data analysis software is used to carry out lithological stratification with the rule of change of logging data, generate borehole histograms and borehole trajectory diagrams, and carry out comprehensive stratigraphic characterization (faults, trap columns, fissures and other tectonic development, etc.) in combination with geological data.
(1)Exploration of water discharge drill holes, gas discharge holes, geological overrun exploration holes, tectonic coal exploration holes, and other types of engineering drill holes with aperture ≧ 50mm;
(2) Applicable to any inclined angle drilling holes including vertical holes;
(3) Detecting problems such as hollowing out areas, causes of water outflow, stratigraphic anomalies, faults, and trapped columns.
(3) Instrument logging results
Mining intrinsically safe resistivity logging instrument mainly relies on natural gamma, resistivity, natural potential, excitation potential, trajectory and other methods for logging boreholes, the main results reflect.
(1) Geological overdraft exploration holes: drilling trajectory, drilling logging comprehensive column;
(2) Gas extraction hole: drilling trajectory, drilling logging comprehensive column;
(3) Water exploration and discharge holes: drilling trajectory, water outlet layer, and comprehensive column of drilling logging;
(4) Tectonic coal exploration holes: drill trajectory, location and thickness of coal seams, and comprehensive column shape of drill logging;
(5) Anchor holes: drilling trajectory, drilling logging comprehensive column.
(4) Instrument composition
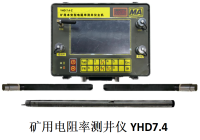
Figure 4-1-1 Instrument Composition Diagram
Mining Intrinsically Safe Resistivity Logging Instrument The instrument is mainly composed of two parts: the probe tube and the host control panel. As shown in Figure 4-1-1, the hardware part consists of:
The probe tube consists of natural gamma, apparent resistivity, excitation potential, natural potential, drilling track measurement and control unit.
Depth counting module obtains the probing depth through the length of the drill pipe and the control unit of the host, and automatically and continuously measures the depth from 0 to 1,000 meters, and the error of the hole depth is ≤0.5%.
This exploration adopts mine intrinsically safe resistivity logging technology to conduct logging on the directional drilling of the thousand bottom 1# holes in the rocky tunnel of the upper basement of a working face in a coal mine, and the main task is to find out the lithological stratification of the thousand bottom 1# holes and deviation of drilling trajectory, so as to provide technical support for the next step of the mine's production.
The specific result information submitted:
(1) Report on the results of the directional drilling logging project for the upper bottom rock tunnel of a working face in a coal mine;
(2) Column diagram of logging of 1# hole of thousand bottom of directional drilling in the upper bottom rock tunnel of a working face of a coal mine;
(3) Trajectory diagram of 1# holes of directional drilling of 1,000 bottom holes in the upper bottom rock tunnel of a working face of a coal mine;
(4) Electronic files of all the results.
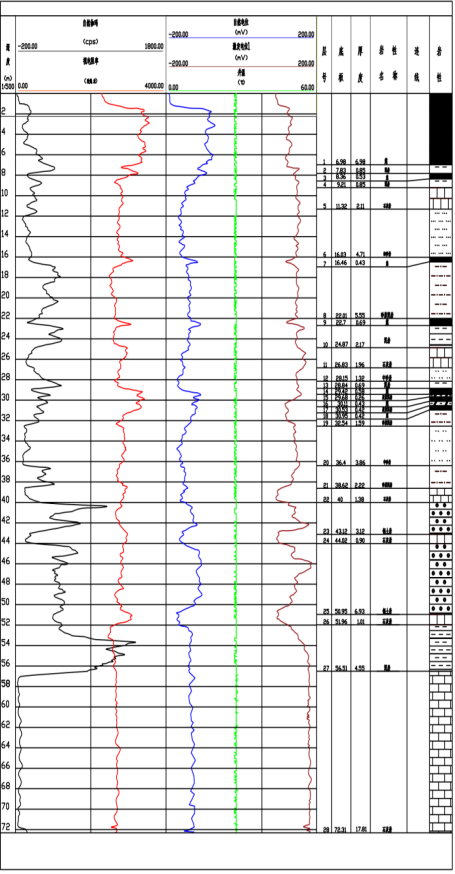
Figure 4-2-1 Drill hole composite histogram (all coal seam thicknesses shown in this figure are pseudo thicknesses)
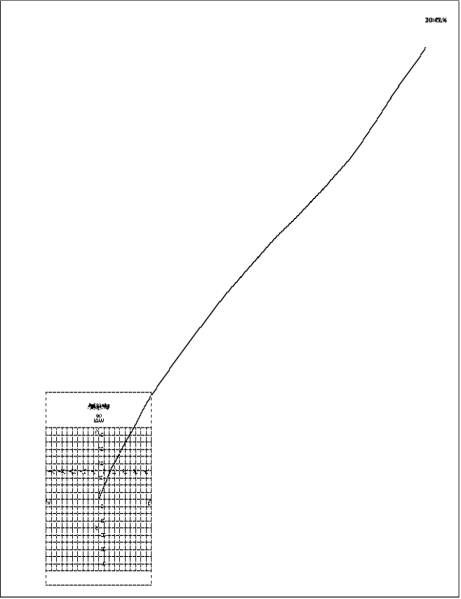
Figure 4-2-2 Drill hole azimuth trajectory diagram
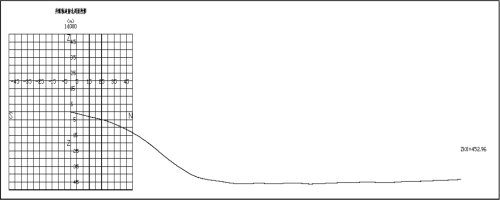
Figure 4-2-3 North-South Profile Projection of Borehole


 Mining Video Imaging Logging Instrument